Trihybrid Cross Punnett Square Calculator

Ahmad zee
Table of Contents
Toggle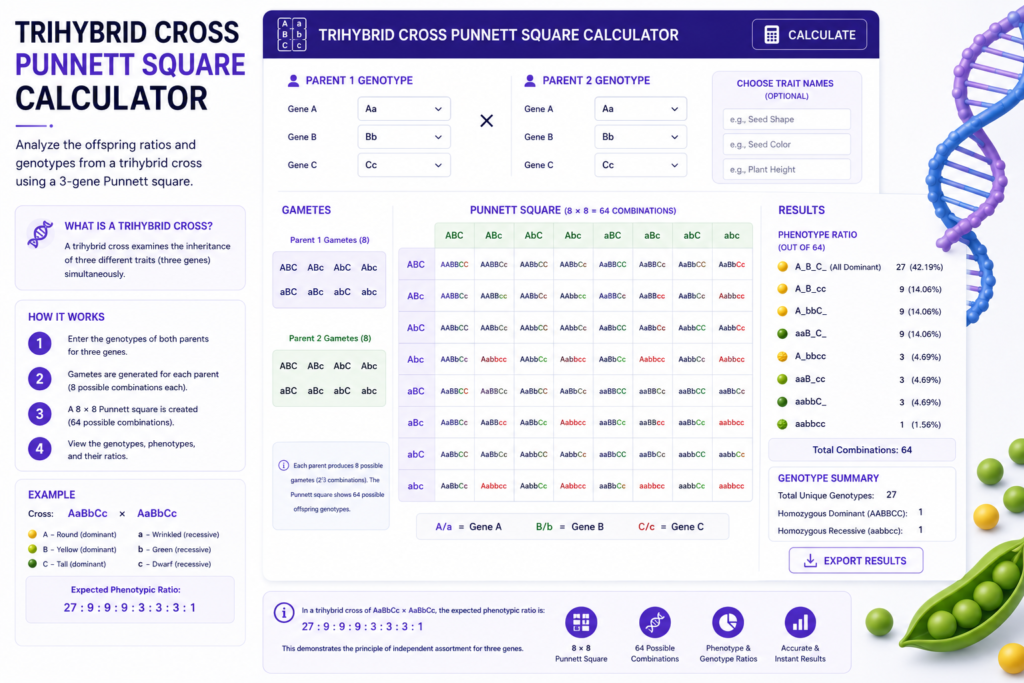
Trihybrid Cross Punnett Square Calculator: The Ultimate Guide to Three-Trait Genetics
Introduction to Trihybrid Crosses
Genetics has always fascinated learners who want to understand how living organisms pass traits from one generation to the next. While single-trait and two-trait crosses provide excellent starting points, real biological systems often involve many genes interacting simultaneously. A trihybrid cross Punnett square calculator brings clarity to one of the most complex scenarios in classical genetics — the simultaneous tracking of three independent traits across a genetic cross.
For students, educators, and researchers working through advanced genetics problems, a trihybrid cross Punnett square calculator removes the burden of manually constructing enormous grids and performing repetitive calculations. Instead, learners can focus on understanding the biological principles that govern how three separate genes assort independently during reproduction.
This guide walks through everything one needs to know about trihybrid crosses, from foundational concepts to practical applications, while showing exactly how a trihybrid cross Punnett square calculator makes this challenging topic approachable and engaging.
What Is a Trihybrid Cross?
A trihybrid cross examines how three genes — each with two alleles — pass from parents to offspring simultaneously. The term “trihybrid” refers to an organism that is heterozygous at three different gene loci, carrying two different alleles for each of the three genes being studied.
Building on Mendelian Principles
Trihybrid crosses extend directly from Gregor Mendel’s foundational genetics work. Mendel established two core laws that make trihybrid cross analysis possible. The law of segregation states that each organism carries two alleles per gene and passes only one to each offspring. The law of independent assortment states that genes on different chromosomes segregate independently during gamete formation.
These two laws together explain why trihybrid crosses produce predictable ratios of offspring phenotypes — and why a trihybrid cross Punnett square calculator can accurately predict those ratios using mathematical principles.
How Trihybrid Crosses Differ From Simpler Crosses
Understanding where trihybrid crosses fit within the broader landscape of genetic analysis helps learners appreciate their complexity and their value.
A monohybrid cross examines a single gene with two alleles, producing a 2×2 Punnett square with four possible offspring combinations. A dihybrid cross simultaneously tracks two genes, requiring a 4×4 Punnett square with sixteen cells. A trihybrid cross tracks three genes simultaneously, requiring an 8×8 Punnett square with sixty-four cells.
This dramatic increase in complexity — from four cells to sixty-four cells — explains why a trihybrid cross Punnett square calculator becomes practically essential rather than simply convenient.
The Mathematics of Trihybrid Crosses
Before exploring how a trihybrid cross Punnett square calculator works, understanding the mathematical foundation helps learners interpret results correctly.
Gamete Combinations in Trihybrid Crosses
When a trihybrid organism (AaBbCc) produces gametes, each gamete receives one allele from each gene pair. Since there are two possible alleles at each of three loci, a trihybrid organism can produce 2³ = 8 different gamete types. These eight gamete combinations are:
- ABC
- ABc
- AbC
- Abc
- aBC
- aBc
- abC
- abc
Each gamete type occurs with equal frequency, assuming independent assortment. A trihybrid cross Punnett square calculator uses this information to construct the complete 8×8 grid.
The 64-Cell Grid
When two trihybrid parents (AaBbCc × AaBbCc) cross, the resulting Punnett square contains 64 cells — one for each possible combination of one gamete from each parent. Each cell represents a possible offspring genotype with an equal probability of occurring.
Manually constructing and filling this 64-cell grid requires careful attention and considerable time. A trihybrid cross Punnett square calculator completes this task instantly, eliminating both the time burden and the risk of errors.
The Classic 27:9:9:9:3:3:3:1 Ratio
The most celebrated result of a trihybrid cross between two fully heterozygous parents is the phenotypic ratio 27:9:9:9:3:3:3:1. This ratio describes the distribution of eight distinct phenotypic classes among offspring:
- 27 offspring display dominant phenotypes for all three traits
- 9 offspring display dominant for traits 1 and 2, recessive for trait 3
- 9 offspring display dominant for traits 1 and 3, recessive for trait 2
- 9 offspring display dominant for traits 2 and 3, recessive for trait 1
- 3 offspring display dominant for trait 1 only
- 3 offspring display dominant for trait 2 only
- 3 offspring display dominant for trait 3 only
- 1 offspring displays recessive phenotypes for all three traits
This elegant ratio totals 64, matching the number of cells in the complete Punnett square. A trihybrid cross Punnett square calculator generates this ratio automatically, saving learners from manually tallying all sixty-four outcomes.
How a Trihybrid Cross Punnett Square Calculator Works
A trihybrid cross Punnett square calculator automates the complex construction and analysis of three-gene crosses. Understanding how the tool operates helps users trust its results and interpret them correctly.
Input Requirements
Most trihybrid cross Punnett square calculator tools require straightforward input:
Parent Genotypes Users enter the genotype of each parent for all three genes. A typical input might look like AaBbCc for a fully heterozygous parent or AABbcc for a parent homozygous dominant at the first locus, heterozygous at the second, and homozygous recessive at the third.
Dominance Relationships Standard trihybrid cross Punnett square calculator tools assume complete dominance for each gene — the dominant allele fully masks the recessive allele. Some advanced calculators allow users to specify incomplete dominance or codominance for individual genes.
Gene Labels Users typically assign meaningful labels to each gene and its alleles, making results easier to interpret in biological context.
Automated Grid Construction
Once parental genotypes are entered, the trihybrid cross Punnett square calculator automatically determines all possible gametes each parent can produce. For a fully heterozygous parent (AaBbCc), this means generating all eight gamete types. For parents with fewer heterozygous loci, the number of unique gametes decreases accordingly.
The calculator then arranges these gametes along the edges of the 8×8 grid and fills each cell by combining one gamete from each parent, producing the complete set of possible offspring genotypes.
Result Generation
After populating the grid, the trihybrid cross Punnett square calculator tallies results across several dimensions:
- Complete list of all offspring genotypes and their frequencies
- Genotypic ratios showing the proportion of each unique genotype
- Phenotypic ratios showing the proportion of each observable phenotypic combination
- Probability percentages for each outcome
- Visual display of the complete Punnett square grid
These comprehensive results give learners a complete picture of the genetic outcomes expected from the cross.
Step-by-Step Guide to Using a Trihybrid Cross Calculator
Getting accurate results from a trihybrid cross Punnett square calculator requires careful preparation and thoughtful data entry. Following a systematic approach ensures reliable outcomes.
Step 1: Define the Three Genes and Their Alleles
Before opening any trihybrid cross Punnett square calculator, clearly define what each gene and allele represents. For example:
- Gene A/a: Seed color (A = yellow, a = green)
- Gene B/b: Seed texture (B = round, b = wrinkled)
- Gene C/c: Plant height (C = tall, c = short)
Clear definitions prevent confusion when interpreting results.
Step 2: Determine Each Parent’s Genotype
Identify the complete three-gene genotype for each parent. If a parent’s genotype is unknown, a test cross (crossing with a homozygous recessive organism) can help reveal it. The trihybrid cross Punnett square calculator needs accurate parental genotypes to produce correct results.
Step 3: Enter Genotypes Into the Calculator
Input each parent’s genotype carefully into the designated fields of the trihybrid cross Punnett square calculator. Double-check each entry before proceeding, as a single character error can alter all results significantly.
Step 4: Specify Any Non-Standard Dominance
If any of the three genes displays incomplete dominance or codominance rather than complete dominance, specify this in the calculator’s settings if the option exists. Standard calculators assume complete dominance unless told otherwise.
Step 5: Generate and Review Results
Submit the genotype information and allow the trihybrid cross Punnett square calculator to generate results. Review the complete 8×8 grid, the genotypic ratios, and the phenotypic ratios carefully.
Step 6: Verify With the Multiplication Rule
As a quick check on calculator results, learners can apply the multiplication rule: multiply the expected ratios from three separate monohybrid crosses to predict the trihybrid result. For AaBbCc × AaBbCc, each monohybrid cross produces a 3:1 phenotypic ratio. Multiplying these together: (3:1) × (3:1) × (3:1) = 27:9:9:9:3:3:3:1. If the calculator matches this prediction, the results are almost certainly correct.
Understanding Genotypic Ratios in Trihybrid Crosses
While phenotypic ratios describe what offspring look like, genotypic ratios describe what genes offspring carry. A trihybrid cross Punnett square calculator reveals both, giving learners a complete genetic picture.
The Complexity of Genotypic Variation
A trihybrid cross between two fully heterozygous parents (AaBbCc × AaBbCc) can produce offspring with an enormous variety of genotypes. Across three gene loci, each with three possible genotypes (AA, Aa, aa), the total number of possible genotype combinations reaches 3³ = 27 unique genotypes.
Counting Homozygous and Heterozygous Offspring
Among the 64 offspring represented in the Punnett square, the trihybrid cross Punnett square calculator can identify:
- Offspring homozygous dominant at all three loci (AABBCC): 1 in 64
- Offspring homozygous recessive at all three loci (aabbcc): 1 in 64
- Offspring heterozygous at all three loci (AaBbCc): 8 in 64
This genotypic detail becomes important when breeders or researchers need to identify organisms with specific genotypes rather than simply observable phenotypes.
Trihybrid Cross Applications in Real-World Genetics
Trihybrid cross Punnett square calculator tools support practical applications across many fields, extending well beyond classroom genetics problems.
Agricultural Plant Breeding
Plant breeders working to develop improved crop varieties frequently deal with multiple traits simultaneously. A trihybrid cross Punnett square calculator helps breeders predict what proportion of offspring from a planned cross will display desired combinations of traits — such as disease resistance, drought tolerance, and high yield occurring together in the same plant.
Animal Breeding Programs
Livestock and companion animal breeders use trihybrid cross principles to predict offspring trait distributions when selecting breeding pairs. Whether developing cattle breeds with ideal body composition, milk production, and temperament, or breeding dogs with specific coat color, size, and conformation combinations, trihybrid cross analysis guides selection decisions.
Genetic Counseling
Medical genetic counselors apply multi-gene inheritance principles when advising families about conditions influenced by several genes. While most hereditary conditions involve more complex genetics than simple trihybrid crosses, understanding trihybrid cross principles helps counselors communicate inheritance concepts clearly.
Research Genetics
Laboratory researchers studying gene interactions, epistasis, and polygenic traits use multi-gene cross analysis regularly. A trihybrid cross Punnett square calculator helps researchers design experiments and predict expected offspring distributions for verification.
Relating Trihybrid Crosses to Mendel’s Laws
Trihybrid crosses represent the most complex scenario directly governed by Mendel’s two fundamental laws. Understanding how these laws apply to three-gene crosses deepens comprehension of genetics broadly.
Independent Assortment With Three Genes
Mendel’s law of independent assortment requires that the genes under study be located on different chromosomes (or far enough apart on the same chromosome to assort independently). In a trihybrid cross, all three genes must assort independently for the classic 27:9:9:9:3:3:3:1 ratio to emerge.
When genes are linked — located close together on the same chromosome — they tend to be inherited together rather than independently. In these cases, the trihybrid cross Punnett square calculator’s standard output won’t accurately predict offspring ratios, and more sophisticated analysis methods become necessary.
Segregation Across Three Loci
The law of segregation operates independently at each of the three gene loci in a trihybrid cross. During gamete formation, the two alleles at each locus separate, with each gamete receiving exactly one allele per locus. This process occurs simultaneously at all three loci, generating the eight gamete types described earlier.
Connecting Trihybrid Crosses to Simpler Genetic Tools
Understanding trihybrid crosses becomes much easier when learners build progressively from simpler concepts. Before tackling a trihybrid cross Punnett square calculator, gaining comfort with foundational tools provides an essential stepping stone.
Students new to genetics benefit from starting with a Punnett square calculator for monohybrid crosses, which introduces the core concepts of dominant and recessive alleles, gamete formation, and genotypic and phenotypic ratios using the simplest possible scenario.
Building on that foundation, working through dihybrid cross calculations helps learners understand independent assortment and the 9:3:3:1 phenotypic ratio before tackling the added complexity of a third gene in trihybrid analysis.
For students who want to understand the molecular basis of the traits being tracked in trihybrid crosses, exploring how DNA sequences convert to mRNA provides meaningful context for why different alleles produce different phenotypes at the molecular level.
Researchers interested in population-level implications of trihybrid cross outcomes can connect individual cross predictions to broader patterns using allele frequency analysis, which tracks how alleles distribute across entire populations rather than single crosses.
When working with genetic data from laboratory experiments, tools like the DNA concentration calculator support the molecular biology techniques used to identify organism genotypes — an essential first step before performing any genetic cross analysis.
Common Challenges and Mistakes in Trihybrid Cross Analysis
Even with a reliable trihybrid cross Punnett square calculator, learners sometimes encounter confusion that leads to misinterpretation:
Confusing Genotypic and Phenotypic Ratios
Genotypic ratios describe genetic makeup, while phenotypic ratios describe observable traits. The 27:9:9:9:3:3:3:1 ratio is a phenotypic ratio. The genotypic ratios are far more complex, involving 27 distinct genotypic classes. A trihybrid cross Punnett square calculator clearly distinguishes between these two types of ratios, but learners must understand the difference to interpret results correctly.
Assuming All Three Genes Are Unlinked
The standard trihybrid cross analysis assumes all three genes assort independently. If any two genes are closely linked on the same chromosome, the calculator’s output won’t accurately reflect actual offspring distributions. Always verify that the genes under study are on different chromosomes before relying on standard trihybrid cross Punnett square calculator results.
Incorrect Gamete Determination
A common manual error involves incorrectly identifying all possible gametes for a given parental genotype. For a trihybrid parent (AaBbCc), there are eight unique gamete types. Missing even one gamete type produces an incomplete and inaccurate Punnett square. A calculator eliminates this error entirely by systematically generating all gamete combinations.
Misidentifying Homozygous vs. Heterozygous Parents
If a parent is homozygous dominant at one locus (e.g., AABbCc rather than AaBbCc), the number of unique gametes decreases to four rather than eight. Entering an incorrect parental genotype into the trihybrid cross Punnett square calculator produces incorrect results, so careful genotype verification remains essential.
Overlooking Epistasis
Standard trihybrid cross analysis assumes that the three genes act independently, with no gene influencing another gene’s expression. Epistasis — where one gene masks or modifies another gene’s expression — changes expected ratios. Learners must recognize that a standard trihybrid cross Punnett square calculator doesn’t account for epistatic interactions unless specifically designed to do so.
Advanced Trihybrid Cross Scenarios
Beyond the classic fully heterozygous trihybrid cross, several variations create interesting and instructive scenarios:
Trihybrid Test Crosses
A trihybrid test cross pairs a trihybrid organism (AaBbCc) with a triply homozygous recessive organism (aabbcc). This produces only eight distinct offspring genotypes — one for each gamete type the heterozygous parent can produce — making the heterozygous parent’s gamete frequencies directly observable through offspring phenotypes.
Test crosses are particularly valuable when researchers need to determine the gamete types a trihybrid organism actually produces, providing evidence for or against independent assortment.
Partially Homozygous Trihybrid Crosses
When one or both parents are homozygous at one or more loci (e.g., AABbCc × AaBBCc), the resulting cross produces fewer unique offspring types. A trihybrid cross Punnett square calculator handles these scenarios efficiently, adjusting grid size and gamete lists based on actual parental heterozygosity.
Trihybrid Crosses With Non-Standard Dominance
When one of the three genes displays incomplete dominance, the number of phenotypic classes increases beyond eight. For example, if gene B shows incomplete dominance (BB produces red, Bb produces pink, bb produces white), the trihybrid cross produces more phenotypic classes than the standard 27:9:9:9:3:3:3:1 ratio predicts. Advanced trihybrid cross Punnett square calculator tools can model these scenarios when configured appropriately.
Educational Uses of Trihybrid Cross Calculators
Educators and students benefit from trihybrid cross Punnett square calculator tools in several specific ways:
Demonstrating Independent Assortment
Trihybrid crosses provide the most compelling demonstration of Mendel’s law of independent assortment available in classical genetics. By showing how three genes sort independently to produce predictable ratios, these crosses make the abstract concept of independent assortment concrete and verifiable.
Building Problem-Solving Skills
Working through trihybrid cross problems, with or without a calculator, develops systematic thinking and careful attention to detail. Students learn to organize complex information, track multiple variables simultaneously, and interpret quantitative results in biological context.
Connecting Mathematics to Biology
Trihybrid crosses elegantly demonstrate how probability theory applies to biological inheritance. The 27:9:9:9:3:3:3:1 ratio emerges from basic multiplication of probabilities — a powerful connection between mathematical reasoning and biological reality.
Preparing for Advanced Genetics Topics
Mastering trihybrid cross analysis prepares students for more advanced genetics topics including polygenic inheritance, quantitative genetics, and genome-wide association studies. The conceptual frameworks established through trihybrid cross work transfer directly to these sophisticated areas.
Interpreting Trihybrid Cross Results in Practice
Once a trihybrid cross Punnett square calculator generates results, applying those results meaningfully to real-world scenarios requires some additional thought:
Working With Small Sample Sizes
The 27:9:9:9:3:3:3:1 ratio describes expected proportions in an infinitely large offspring population. In practice, real crosses produce finite numbers of offspring that fluctuate around expected ratios. With only 64 offspring, the expected ratio might not be apparent. With thousands of offspring, the ratio becomes clear. Understanding this statistical principle prevents misinterpreting natural variation as evidence of incorrect calculations.
Using Chi-Square Tests
When researchers want to verify whether observed offspring numbers match expected ratios from a trihybrid cross, the chi-square test provides statistical evidence. If observed ratios match expected ratios within statistical expectation, the data support the trihybrid cross model. Significant deviations suggest gene linkage, epistasis, or other complicating factors.
Back-Calculating Parental Genotypes
When researchers observe specific offspring phenotypic ratios from an unknown cross, they can work backward to determine probable parental genotypes. A trihybrid cross Punnett square calculator helps by allowing users to test different parental genotype combinations until one produces results matching observed offspring distributions.
Practice Problems for Trihybrid Cross Mastery
Working through practice problems solidifies understanding of trihybrid cross concepts and builds confidence with the trihybrid cross Punnett square calculator:
Problem 1: Classic Trihybrid Cross Two pea plants with genotypes AaBbCc and AaBbCc reproduce. Using a trihybrid cross Punnett square calculator, determine the expected phenotypic ratio among offspring. How many of the 64 possible offspring will display all three dominant phenotypes?
Problem 2: Partially Homozygous Cross A plant with genotype AABbCc crosses with a plant of genotype AaBbcc. How many unique gamete types can each parent produce? Use a trihybrid cross Punnett square calculator to determine the offspring genotypic and phenotypic ratios.
Problem 3: Trihybrid Test Cross An organism with genotype AaBbCc crosses with an organism of genotype aabbcc. List the expected offspring phenotypes and their frequencies. How does this result differ from the AaBbCc × AaBbCc cross?
Problem 4: Reverse Engineering A researcher observes offspring in a ratio of approximately 27:9:9:9:3:3:3:1. What were the most likely parental genotypes? What law of genetics does this ratio demonstrate?
Problem 5: Non-Standard Dominance In a trihybrid cross, gene B shows incomplete dominance with three distinguishable phenotypes. How does this change the number of phenotypic classes expected among offspring? Predict the new phenotypic ratio.
The Future of Trihybrid Cross Calculators
As technology advances, trihybrid cross Punnett square calculator tools continue evolving to meet expanding needs:
Integration With Genomic Data
Future trihybrid cross Punnett square calculator tools may connect directly to genomic databases, allowing researchers to use actual gene sequences and real allele frequencies rather than simplified letter notation.
Expanded Gene Number Support
While trihybrid crosses represent a significant computational challenge, future tools may seamlessly handle four, five, or even more genes simultaneously — what might be called tetrahybrid or polyhybrid cross calculators.
Visual Simulation
Advanced visualization features may allow students to see animated simulations of gamete formation, fertilization, and offspring development alongside trihybrid cross Punnett square calculator results, deepening conceptual understanding through dynamic visual representation.
Artificial Intelligence Assistance
Future calculator tools may incorporate AI-driven guidance that identifies likely parental genotypes from observed offspring data, suggests appropriate genetic models, or flags when results deviate from expected patterns in ways that suggest complicating genetic factors.
Mobile and Classroom Integration
As educational technology advances, trihybrid cross Punnett square calculator tools will likely integrate more deeply with classroom management systems, allowing teachers to assign cross problems, track student progress, and provide instant feedback through connected platforms.
Conclusion: Mastering Three-Trait Genetics With Confidence
The trihybrid cross Punnett square calculator represents one of genetics education’s most powerful tools, transforming what would otherwise be an unwieldy sixty-four-cell manual calculation into an instant, accurate, and visually clear result. By automating the mathematical complexity of three-gene cross analysis, these calculators allow learners to focus on the biological principles, patterns, and real-world applications that make genetics fascinating.
Whether exploring the elegant 27:9:9:9:3:3:3:1 phenotypic ratio, investigating how three genes assort independently during gamete formation, or applying trihybrid cross principles to plant breeding and genetic counseling scenarios, learners who master trihybrid cross analysis gain a sophisticated understanding of heredity that extends naturally into advanced genetics topics.
The journey from simple monohybrid crosses to complex trihybrid cross analysis reflects genetics education’s broader arc — building systematically from simple principles to complex applications, always guided by Mendel’s enduring laws of segregation and independent assortment. A reliable trihybrid cross Punnett square calculator makes this journey accessible to every learner, regardless of mathematical background, by handling computational complexity while leaving the biological thinking — the most rewarding part — to the student.