qPCR Efficiency Calculator

Ahmad zee
Table of Contents
Toggle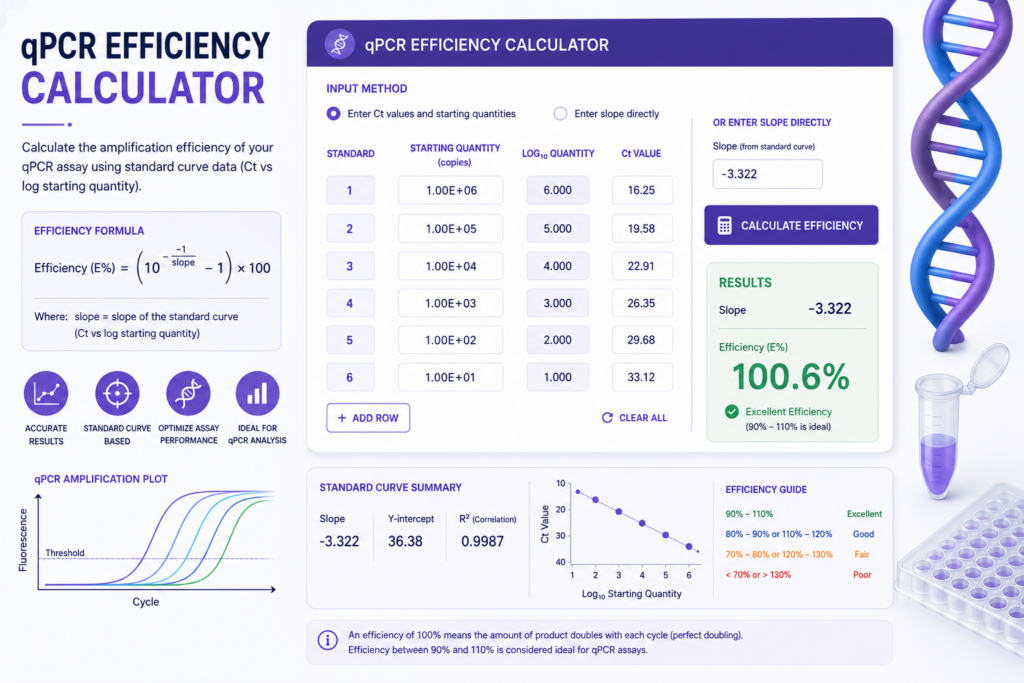
qPCR Efficiency Calculator: The Complete Guide to Accurate Gene Expression Analysis
Introduction to qPCR and Why Efficiency Matters
Quantitative PCR (qPCR) has become one of the most widely used techniques in modern molecular biology laboratories. Whether researchers are analyzing gene expression, detecting pathogens, or quantifying nucleic acids, qPCR delivers precision and sensitivity that few other methods can match. At the heart of every reliable qPCR experiment lies one critical parameter — reaction efficiency. A qPCR efficiency calculator helps researchers determine whether their reactions are performing optimally, making it an indispensable tool for anyone working in molecular biology.
Without understanding and measuring PCR efficiency, even the most carefully designed experiments can produce misleading results. A qPCR efficiency calculator takes the guesswork out of this process, providing clear, accurate efficiency values that researchers can trust when drawing conclusions from their data.
What Is qPCR Efficiency?
PCR efficiency describes how effectively a qPCR reaction amplifies its target DNA or cDNA sequence during each amplification cycle. In a perfectly efficient reaction, the target sequence doubles during every single cycle — this represents 100% efficiency, or an efficiency value of 2 when expressed as a fold-change per cycle.
Why Perfect Efficiency Is the Goal
When a qPCR reaction runs at 100% efficiency, each cycle produces exactly twice the amount of target DNA present in the previous cycle. This predictable, exponential amplification forms the mathematical foundation for calculating gene expression levels, viral loads, and other quantitative measurements. A qPCR efficiency calculator determines how closely a given reaction approaches this ideal performance.
What Happens When Efficiency Drops
Efficiency values below 90% indicate problems with the reaction. Poor primer design, inhibitors in the sample, suboptimal reaction conditions, or template quality issues can all reduce efficiency. When efficiency varies between a target gene and a reference gene, comparative quantification methods like the delta-delta Ct method produce inaccurate results. This is precisely why calculating and verifying PCR efficiency before proceeding with experiments is so important.
Acceptable Efficiency Ranges
Most molecular biology guidelines consider qPCR reactions acceptable when their efficiency falls between 90% and 110%. A qPCR efficiency calculator helps researchers quickly determine whether their reactions fall within this acceptable range or require optimization.
The Science Behind qPCR Efficiency Calculations
Understanding the mathematics that a qPCR efficiency calculator uses helps researchers interpret results correctly and troubleshoot problems when they arise.
The Standard Curve Method
The most common approach to calculating qPCR efficiency involves generating a standard curve from serial dilutions of a known template. The relationship between template concentration and Ct (cycle threshold) values follows a predictable mathematical pattern that forms the basis for efficiency calculation.
When template concentration decreases by half in each serial dilution, the Ct value should increase by exactly one cycle (assuming 100% efficiency). By plotting Ct values against the log of template concentration, researchers create a straight line whose slope reveals the reaction’s efficiency.
The Efficiency Formula
A qPCR efficiency calculator uses the following core formula to determine efficiency from the standard curve slope:
E = 10^(-1/slope) – 1
Where:
- E represents efficiency expressed as a decimal (multiply by 100 for percentage)
- slope represents the slope of the linear regression line fitted to the standard curve data
For a perfectly efficient reaction, the slope equals approximately -3.322, producing an efficiency of 1.0 or 100%. A qPCR efficiency calculator automatically applies this formula once users provide their slope value or raw Ct data.
R² Value and Linearity
Alongside efficiency, the coefficient of determination (R²) indicates how well the data fits the linear regression model. Most guidelines require R² values of 0.99 or higher, indicating excellent linearity across the tested dilution range. A comprehensive qPCR efficiency calculator reports both efficiency and R² values, giving researchers a complete picture of assay performance.
How to Use a qPCR Efficiency Calculator
A well-designed qPCR efficiency calculator guides researchers through the efficiency calculation process systematically. Understanding each step ensures accurate results and proper interpretation.
Step 1: Prepare Serial Dilutions
Before using a qPCR efficiency calculator, researchers need Ct data from a serial dilution experiment. Typically, this involves preparing 4–6 serial dilutions (often 1:5 or 1:10 dilutions) of a known template across several orders of magnitude. Each dilution should be run in triplicate to ensure reproducibility.
Step 2: Run qPCR Reactions
Perform qPCR reactions on all dilutions under standard experimental conditions. The same primers, reagents, and cycling parameters used in the actual experiment should be used during the efficiency validation run to ensure relevance.
Step 3: Collect Ct Values
Record average Ct values for each dilution point. Most qPCR instruments automatically calculate average Ct values from technical replicates. These average values feed directly into the qPCR efficiency calculator.
Step 4: Enter Data Into the Calculator
A qPCR efficiency calculator typically requires two inputs for each dilution point:
- The log of the template concentration (or a relative dilution factor)
- The corresponding average Ct value
Some calculators accept raw dilution values and convert them to logarithmic scale automatically.
Step 5: Review Calculated Results
After entering all data points, the qPCR efficiency calculator performs linear regression analysis and calculates the slope of the best-fit line. It then applies the efficiency formula to generate the efficiency percentage and R² value.
Step 6: Interpret and Act on Results
Interpret results in context. An efficiency between 90% and 110% with an R² above 0.99 indicates a well-optimized assay ready for reliable quantification. Efficiency outside this range signals the need for optimization.
Building a Standard Curve for qPCR Efficiency
The standard curve forms the foundation for qPCR efficiency calculation. Building an accurate standard curve requires careful attention to several key factors.
Template Selection
The ideal template for a standard curve closely mimics the actual experimental samples. Researchers can use purified PCR products, plasmid constructs containing the target sequence, or serial dilutions of a representative cDNA sample. Using a template that matches experimental samples ensures efficiency measurements reflect actual experimental conditions.
Dilution Strategy
Most researchers prepare 5- or 10-fold serial dilutions spanning at least 5 orders of magnitude. This broad range helps identify any non-linearity at extreme template concentrations and provides enough data points for reliable regression analysis.
Technical Replicates
Running triplicate reactions at each dilution point helps identify outliers and improves the reliability of average Ct values. A qPCR efficiency calculator produces more accurate results when fed high-quality, replicated data rather than single measurements.
Consistent Conditions
The standard curve experiment must use identical reaction conditions to actual experiments. Any difference in primer concentration, polymerase, buffer composition, or cycling parameters could cause the measured efficiency to differ from the true experimental efficiency.
Common Causes of Poor qPCR Efficiency
When a qPCR efficiency calculator reveals efficiency outside the acceptable 90–110% range, understanding potential causes helps guide optimization:
Primer Design Issues
Poorly designed primers represent one of the most common causes of inefficient qPCR reactions. Primers that form dimers, hairpin structures, or bind to multiple locations in the genome reduce amplification efficiency. Optimal primer design targets 18–25 base pairs with melting temperatures between 58°C and 62°C and GC content between 40% and 60%.
Inhibitors in the Sample
Biological samples often contain substances that inhibit PCR amplification. Heme from blood, polysaccharides from plant material, humic acids from soil, and other compounds reduce reaction efficiency. When a qPCR efficiency calculator reveals unusually low efficiency with a specific sample type, inhibition often explains the problem.
Suboptimal Magnesium Concentration
Magnesium chloride concentration critically affects PCR efficiency. Too little magnesium results in weak amplification, while too much causes non-specific products and reduced efficiency. Most qPCR master mixes contain optimized magnesium concentrations, but researchers sometimes need to adjust this parameter when using custom reaction setups.
Template Quality Problems
Degraded RNA or DNA templates, RNA samples containing DNA contamination, or cDNA prepared from low-quality RNA all reduce qPCR efficiency. Checking template quality before running experiments prevents efficiency problems and wasted reagents.
Amplicon Size and Structure
Longer amplicons require more time to synthesize during each cycle, potentially reducing efficiency when extension time is insufficient. Additionally, amplicons with strong secondary structures can impede polymerase progression. Most qPCR assays target amplicons between 80 and 200 base pairs to maintain high efficiency.
Reaction Volume and Scaling Issues
Scaling qPCR reactions up or down from standard volumes sometimes affects efficiency. This can happen due to surface-to-volume ratio changes or inconsistent mixing. A qPCR efficiency calculator can help identify these issues by revealing efficiency changes when reaction volumes change.
Interpreting qPCR Efficiency Results
Once a qPCR efficiency calculator produces results, proper interpretation becomes critical:
High Efficiency (90–110%)
Efficiency values within this range indicate a well-optimized assay. The reaction amplifies target DNA predictably and reliably, supporting accurate quantification. Researchers can proceed with confidence knowing their data will accurately reflect biological differences between samples.
Low Efficiency (Below 90%)
Efficiency below 90% indicates the reaction amplifies less than expected. Each cycle produces fewer copies than it should, meaning the Ct value underestimates the actual template amount. This causes relative quantification to overestimate differences between samples. Optimization is required before proceeding.
High Efficiency (Above 110%)
Efficiency above 110% seems counterintuitive — how can a reaction amplify more than double per cycle? This typically indicates non-specific amplification, primer dimer formation, or problems with the standard curve. The template may not be as dilute as expected, or multiple products may be amplifying simultaneously. Investigation and optimization are essential.
Non-Linear Standard Curves
When R² values fall below 0.99, the standard curve lacks linearity, indicating problems at specific concentration ranges. This might reflect inhibition at high template concentrations, amplification failure at very low concentrations, or pipetting errors. A qPCR efficiency calculator reporting low R² values signals the need to re-examine the dilution series.
qPCR Efficiency and Relative Quantification Methods
Reaction efficiency directly impacts the accuracy of relative quantification methods used to compare gene expression between samples.
The Delta-Delta Ct Method
The popular delta-delta Ct (ΔΔCt) method assumes equal efficiency between target and reference genes. When efficiency differs significantly between these genes, calculated expression ratios become inaccurate. A qPCR efficiency calculator verifies whether efficiency matching exists, and if not, guides researchers toward efficiency-corrected calculation methods.
Efficiency-Corrected Quantification
When target and reference gene efficiencies differ, efficiency-corrected quantification methods account for these differences. These methods incorporate measured efficiency values into the calculation, producing accurate expression ratios regardless of efficiency differences. A qPCR efficiency calculator provides the efficiency values these methods require.
Reference Gene Selection
Selecting appropriate reference genes for normalization requires verifying not just their stability across experimental conditions but also their qPCR efficiency. A reference gene with dramatically different efficiency than the target gene creates systematic error in relative quantification. Always verify reference gene efficiency using a qPCR efficiency calculator before committing to a normalization strategy.
Connecting qPCR Efficiency to Broader Molecular Biology Workflows
qPCR efficiency calculation fits within a broader molecular biology workflow. Researchers using a qPCR efficiency calculator benefit from understanding how this tool connects to other essential laboratory calculations.
Successful qPCR experiments begin with high-quality template preparation. Accurate DNA concentration measurement ensures templates are appropriately quantified before dilution series preparation. Poor concentration estimates translate directly into inaccurate standard curves and misleading efficiency values.
Before qPCR amplification can succeed, primer design must be optimized for the target sequence. The annealing temperature calculator helps researchers determine optimal primer annealing temperatures, directly influencing reaction efficiency and specificity.
When preparing standard dilution series, accurate cell dilution calculations ensure template concentrations are precisely what researchers intend, improving standard curve quality and the reliability of efficiency values generated by the qPCR efficiency calculator.
For experiments involving bacterial or cell culture templates, understanding generation time and growth rates helps researchers harvest cells at appropriate growth phases, ensuring consistent template quality across experiments.
Additionally, researchers working with cloning-based templates for standard curves benefit from ligation calculator tools to optimize insert-to-vector ratios, producing high-quality plasmid templates for qPCR standard curves.
Troubleshooting qPCR Efficiency Problems
When a qPCR efficiency calculator reveals efficiency outside acceptable limits, a systematic troubleshooting approach helps identify and resolve the issue:
Reassess Primer Design
Return to primer design software and re-evaluate your primers. Check for self-complementarity, primer-dimer potential, and specificity against the target genome. Consider redesigning primers if any issues are identified.
Test for Inhibition
Dilute the experimental template 1:10 or 1:100 in water or buffer and re-run the efficiency test. If efficiency improves dramatically with dilution, inhibitors in the original sample are likely responsible.
Optimize Magnesium Concentration
Prepare a magnesium optimization experiment testing several magnesium chloride concentrations (typically ranging from 1.5 mM to 5 mM). Identify the concentration producing the highest efficiency and sharpest melt curve.
Check Template Integrity
Run the template on an agarose gel or assess RNA quality using a bioanalyzer or similar instrument. Replace degraded templates with freshly prepared material of higher quality.
Adjust Extension Time
If amplicon length might be causing efficiency problems, extend the polymerase extension time during the qPCR cycling protocol. A general guideline is allowing approximately 1 minute per kilobase of amplicon.
Re-Examine the Standard Curve
Verify all dilutions were prepared correctly and that Ct values were entered accurately into the qPCR efficiency calculator. Even small pipetting errors can produce misleading slopes and incorrect efficiency values.
Advanced Applications of qPCR Efficiency Calculators
Beyond basic assay validation, qPCR efficiency calculators support several advanced applications:
Multiplex qPCR Optimization
Multiplex qPCR simultaneously amplifies multiple targets in a single reaction. Ensuring all targets achieve similar efficiency is critical for reliable simultaneous quantification. A qPCR efficiency calculator helps optimize multiplex assays by identifying targets with problematic efficiency that might interfere with co-amplified sequences.
Digital PCR Comparison
Researchers transitioning from qPCR to digital PCR can use qPCR efficiency data to contextualize results from both platforms. Understanding qPCR efficiency limitations helps researchers recognize where digital PCR’s absolute quantification approach offers advantages.
Assay Transfer and Validation
When laboratories transfer qPCR assays between instruments, reagent lots, or operators, re-calculating efficiency validates that the transfer maintained assay performance. A qPCR efficiency calculator makes this validation straightforward and documentable.
Clinical Diagnostic Applications
Clinical laboratories performing diagnostic qPCR for infectious disease detection or genetic testing must rigorously validate assay efficiency. Regulatory standards often require documented efficiency data for diagnostic assays. A qPCR efficiency calculator produces the documentation these validation processes require.
Best Practices for Reliable qPCR Efficiency Calculations
Following established best practices ensures qPCR efficiency calculations remain reliable and reproducible:
Always Run Efficiency Tests Before New Experiments
Efficiency can change between template preparations, reagent lots, or instrument conditions. Running a standard curve before each new experimental series ensures efficiency values reflect current conditions.
Use Sufficient Dilution Points
Regression analysis becomes more reliable with more data points. Using at least five dilution points across a broad concentration range produces more accurate slope calculations and more reliable efficiency values from the qPCR efficiency calculator.
Maintain Consistent Reaction Conditions
The standard curve experiment must exactly mirror actual experimental conditions. Any deviation — in primer concentration, annealing temperature, polymerase, or reaction volume — makes the measured efficiency irrelevant to the actual experiment.
Document All Efficiency Data
Maintain thorough records of efficiency measurements for each assay. This documentation helps identify gradual efficiency changes over time and provides evidence for troubleshooting when experimental results seem inconsistent.
Validate New Primer Sets Before Use
Before committing to a new primer set for important experiments, calculate efficiency using a qPCR efficiency calculator. This simple validation step prevents wasted time and resources on experiments built on inefficient reactions.
Real-World Applications of qPCR Efficiency Calculation
qPCR efficiency calculator tools support researchers across diverse fields:
Clinical Virology
Virologists measuring viral loads in patient samples depend on accurate qPCR efficiency to convert Ct values into meaningful viral copy numbers. Accurate efficiency values ensure viral load measurements reflect true biological differences between patients.
Oncology Research
Cancer researchers studying gene expression differences between tumor and normal tissue rely on qPCR efficiency data to validate their quantification methods. Efficiency calculations confirm that observed expression differences reflect genuine biological changes rather than technical artifacts.
Agricultural Biotechnology
Plant biologists analyzing transgene expression, pathogen detection, or stress response gene regulation use qPCR efficiency calculations to validate their assays before drawing conclusions from expression data.
Food Safety Testing
Food safety laboratories detecting pathogens in food products rely on validated qPCR assays with documented efficiency. A qPCR efficiency calculator helps these laboratories meet regulatory requirements for assay validation.
Environmental Monitoring
Environmental scientists quantifying microbial communities, tracking pollutant-degrading organisms, or monitoring invasive species use qPCR with validated efficiency values to produce reliable quantitative data.
Choosing the Right qPCR Efficiency Calculator
Several qPCR efficiency calculator tools exist, each with different features suited to different users:
Features to Prioritize
An ideal qPCR efficiency calculator should offer:
- Simple, intuitive data entry for Ct values and dilution factors
- Automatic linear regression analysis
- Clear display of slope, efficiency percentage, and R² value
- Graphical representation of the standard curve
- Ability to export or save results for documentation
User Interface Considerations
Researchers spending significant time on efficiency calculations benefit from clean, uncluttered interfaces that minimize data entry errors. Mobile compatibility allows efficiency calculations at the bench rather than requiring a return to a desk computer.
Batch Processing Capability
Laboratories running many assays simultaneously benefit from qPCR efficiency calculator tools that process multiple assays in a single session, saving time and ensuring consistent calculation methodology across all assays.
The Future of qPCR Efficiency Analysis
Technology continues advancing qPCR efficiency calculation methods and tools:
Automated Efficiency Calculation
Modern qPCR instruments increasingly integrate efficiency calculation into their software, automatically generating efficiency values from built-in standard curves without requiring separate calculator tools.
Machine Learning Applications
Emerging machine learning approaches may soon predict qPCR efficiency from primer sequences and reaction conditions, allowing researchers to identify efficiency problems before running experiments.
Real-Time Monitoring
Future qPCR platforms may calculate efficiency in real time during the amplification process, dynamically adjusting reaction conditions to maintain optimal efficiency throughout the run.
Conclusion: Why Every qPCR Researcher Needs an Efficiency Calculator
The qPCR efficiency calculator represents an essential component of every serious molecular biology workflow. By quantifying how effectively a qPCR reaction amplifies its target, this tool helps researchers validate assay performance, troubleshoot problems, and produce data they can trust.
Whether a researcher is establishing a new assay, transferring a method between laboratories, or troubleshooting unexpected results, a qPCR efficiency calculator provides the objective, quantitative information needed to make informed decisions. The 90–110% efficiency window isn’t arbitrary — it reflects decades of experience showing that reactions within this range produce reliable, reproducible quantification data.
As molecular biology continues advancing, the importance of rigorous assay validation only grows. By incorporating qPCR efficiency calculation into standard laboratory practice, researchers ensure their data meets the highest standards of quality and reproducibility, ultimately contributing to more reliable scientific knowledge and better outcomes in research, diagnostics, and clinical applications.